8 Important Retail Merchandising KPIs in Category Management
Modern technology and research methods have provided the retail industry with incredible access to consumer data. When correctly analyzed, this information can be used to understand consumers and improve organizational performance.
Today's Category Managers and Consumer Insights Analysts use technology like virtual reality eye tracking and artificial intelligence to gather market research. These advanced research tools are able to generate an incredible amount of big data. Big data offers detailed insights into non-conscious consumer processes such as behaviors, preferences, and bias.
This information can be utilized effectively to better understand shopper purchase decisions, improve products, and enhance store experiences. In order to do so, it is necessary to measure, track, and reflect on key performance indicators (KPIs). The following are examples of important brick and mortar retail KPIs that are collected during market research.
1. Fixations and gaze points
Eye tracking in retail stores is a leading research method used to discover what products draw consumers attention. It allows product manufacturers and retailers to view products from an unbiased consumer perspective. This allows them to optimize packaging appeal, brand recognition, shelf positioning and findability.
The basic eye tracking outputs include fixations and gaze points. These fixation points are visualized through heat maps that interpret distinct levels of visual attention through red, yellow, and green colors. The retail heatmap visual offers a clear picture of what elements draw more in-store attention. They also easily adjust to reflect specific data from different consumer groups for in-depth analysis.

2. Fixation durations
Understanding how long a product or area keeps a consumers attention is another retail merchandising metric generated from eye tracking technology. The two fundamental measurements of this attention span are called average fixation duration and first fixation duration.
The average fixation duration identifies how long a consumer looked at something. It is helpful in determining absorption of marketing messaging or confusion around a product. The first fixation duration conveys how long an individual looked at something for the first time. First fixation duration offers insight into what initially attracts consumer attention.
3. Consumer traffic
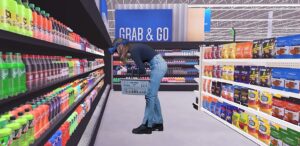
Measuring shopper path to purchase behavior and overall retail store foot traffic is essential in making store layout decisions. Using the foot traffic KPI, retailers can improve where categories and products are placed throughout the store to generate more sales.
Consumer traffic information can be displayed using a retail store heat map with straightforward path heatmap visuals. A path heat map provides a top down camera view of consumer routes taken in the store. They allow researchers to analyze popular areas of consumer traffic.

4. Consumer stopping power
Consumer stopping power is calculated using eye-tracking data including percent total users noticed and average fixation duration spent with the ad, product, or area of interest. This metric measures the ability something has to make a potential customer stop, notice, and make a purchase.
The consumer stopping power informs organizations on how well they are attracting their target shoppers’ attention. A retailer's ultimate goal is to increase stopping power to better interrupt and engage their shoppers.
5. Total users noticed
The total users noticed ratio is a merchandising KPI that describes how many consumers viewed a product or stimuli. It is relevant in evaluating what types of people are drawn to something and how it appeals to the mass public.
Advertising optimization utilizes total users noticed to discover what messaging or visuals draw more people to look at a specific ad. This KPI can assist organizations in understanding what products, advertisements, and retail areas draw the most or least attention. The total users noticed ratio also reveals details into what retail solutions are more attractive to particular groups of people.

6. Number of revisits
Tracking the number of revisits is a retail metric that counts how many times a shopper revisited a certain spot with their gaze.
Revisits allow researchers to determine which areas repeatedly attracted consumers, but were ultimately moved on from with or without action. This data is used to pinpoint areas that are appealing or confusing and may require further examination.
7. Conversion rate
A conversion rate is the number of individuals that actually made the final purchase of a product compared to those who did not. This provides retailers with information on where a customer spends, what shoppers are purchasing, and their average transaction amounts.
The conversion rate is a prominent KPI due the fact that it allows retail businesses to predict profitability through providing insight into what factors turn shoppers into buyers. Conversion information is crucial in merchandising because the only way to grow sales is to ensure store visitors convert into paying customers.
Conversion data is also commonly expanded upon to find out how long consumers take to covert and which retailers offer higher or lower conversion rates.

8. Sales per square foot
The category management metrics of shelf length, total visual area, number of product facings, and number of products are used to find retail store sales per square foot.
The sales per square foot KPI identifies how effectively a store is using its retail space. This information can offer great insight into where and what merchandising layouts are performing well or are in need of improvement.
These metrics are often visualized with a simple grocery store heat map that measures aisle layout performance to provide insight on where improvements can be made in order to drive sales.
Subscribe to our newsletter
Get our blogs and the latest retail news delivered to your inbox monthly.
Recent Posts

4 Hot Retail Topics at RICE 2022
After attending the Chicago Retail Innovation Conference & Expo 2022, we recap the biggest trends in retail discussed by top brands and retailers. There are numerous new business practices being implemented in physical stores post-covid. From introducing live commerce to reducing your carbon footprint, let’s explore every hot topic at the retail innovation conference 2022.…
ReadySet, which develops VR innovation capabilities for Retailers and CPGs, secures $3.25 Million in funding
Financing to fund growth of ReadySet’s development team and further product capabilities for VR retail innovation. ReadySet Technologies, a virtual reality (VR) software company based in De Pere, Wisconsin that provides digital innovation tools to consumer brands, has announced $3.25 Million in new funding led by Rock River Capital and includes participation from Mendota Venture…

5 Best Retail Design Presentation Ideas
Knowing how to present your product to retailers is critical in nailing your next sales pitch. The following sales pitch presentation examples provide tips on how to better engage potential investors. 1. Deliver a personalized message to your target audience The first step in creating a sales pitch presentation is to understand your target audience.…