The 6 Different Types of Planograms
When creating a planogram, the first step is to consider which type needs to be created. We will explore numerous planogram examples and how they are intended to serve different retail purposes.
Category Management is a strategic discipline focused on defining and managing product categories within a retail store. A pivotal tool in achieving this goal is the development of planograms. While there is a common understanding of how plannogramming helps with merchandising decisions, the diverse range of planogram types utilized for this purpose may not be widely acknowledged.
By employing planogramming software for visual merchandising, category managers can create and implement these distinct space plans. At ReadySet, our cutting-edge assortment planning software, empowers category managers with a range of versatile tools to craft a wide variety of planogram solutions. Now let's delve into the several kinds of planograms generated using visual merchandising software during the store planning process.
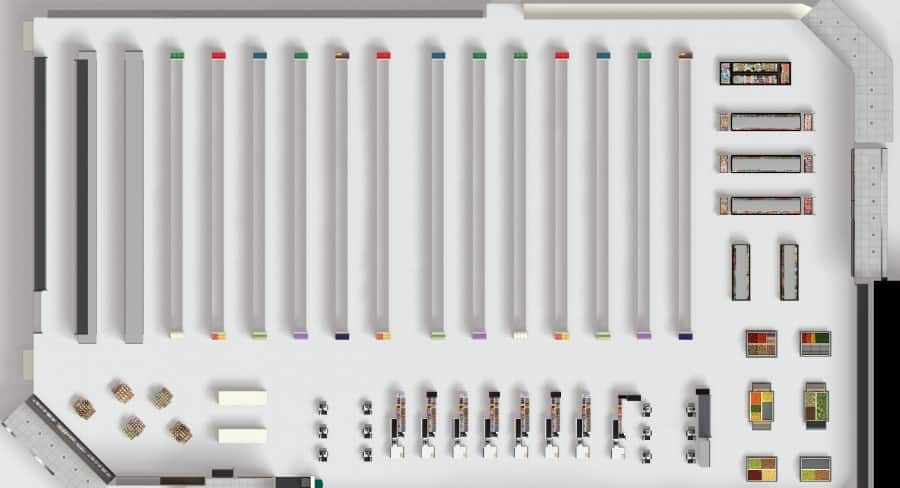
1. Floor Plan POG
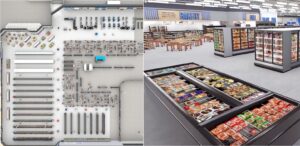
A Floor Plan Planogram (Floor Plan POG) is a visual representation of the overall layout of a retail store or a specific section within the store. It is used to determine how products should be placed on the sales floor. Floor plan planograms provide a bird's-eye view of the store, indicating the placement of aisles, shelving, displays, departments, and various product categories.
The primary purpose of a floor plan POG is to optimize the arrangement of the store's physical space to enhance the shopping experience, improve customer flow, and maximize sales. It ensures that products are strategically positioned to attract customers' attention, guide them through the store, and make it easy for them to find what they are looking for.
In addition to product placement, floor plan planograms may consider factors such as lighting, signage, traffic flow, and display locations for promotional items. Retailers often update their floor plan planograms to accommodate changes in merchandise, seasonal displays, and promotions.
Examples of floor plan planograms:
- Space Optimization Planogram: Space optimization planograms are visual representations of layout plans used by retailers to make the best use of available shelf space and enhance overall store efficiency. This type of planogram is designed to maximize the utilization of the store's physical space by placing products strategically, often based on data and analytics. The goal is to optimize product placement to increase sales and operational efficiency.
- Store Reset: The reset of a store refers to a strategic and planned process carried out by retailers to make significant changes to the store's layout, product placement, and overall visual merchandising. They involve store staff rearranging product displays, changing the placement of merchandise, updating signage, and implementing new planograms or layouts to accommodate shifts in customer demand, seasonal changes, new product launches, or promotional campaigns. The primary purpose of a store reset is to refresh the store's appearance, improve the shopping experience, boost sales, and align the store with changing merchandising strategies.
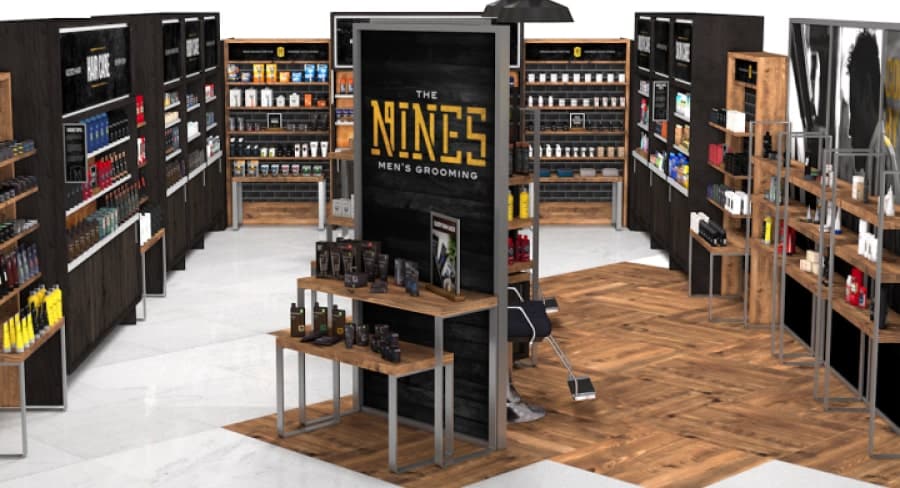
2. Display POG
Display planograms are visual representations that outline how retailers intend to arrange products within specific, high-visibility display areas of the store. These areas often include sections like endcaps (displays at the end of aisles), entrance displays, window displays, and other prominent areas designed to catch customers' attention.
The primary objective of a Display POG is to create visually appealing and attention-grabbing product displays that drive sales and engage customers. Retailers use this type of planogram to maximize the impact of their promotional efforts and enhance the shopping experience. It's also instrumental in adhering to brand standards and maintaining a consistent store image.
A Display POG goes beyond merely specifying the placement of products; it considers factors such as product grouping, signage, lighting, and even the use of props or decor to create a captivating presentation. Additionally, it's crucial for ensuring that promotional items are prominently featured, aligning with marketing and sales strategies.
Examples of display planograms:
- Seasonal Planogram: Adjusts the store layout and product placement for different seasons, holidays, or special events, creating themed displays to attract customers and boost sales during specific times of the year.
- Promotional Planogram: Creates displays for promotional items or sales events, ensuring promotional products are prominently displayed and easily accessible to customers.
- Micro Space Planogram: Optimizes the layout of specific areas or sections within the store, such as end caps or island displays, to maximize sales in smaller, high-visibility spaces.
- Visual Merchandising Planogram: Focuses on creating visually appealing displays to engage customers, considering factors like color, lighting, signage, and product placement to enhance the shopping experience.
- Experiential Planogram: Used in stores where the shopping experience is a key factor, creating unique and engaging displays that encourage customer interaction with products.
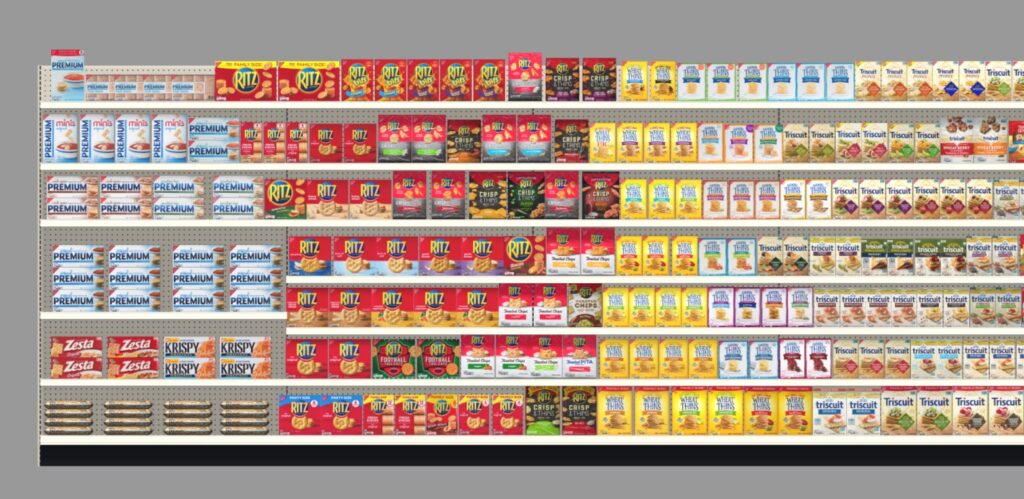
3. Image/shelf POG
The retail shelf display planogram is the classic image that comes to mind when most people think of a planogram. Shelf planograms primarily focus on how products should be arranged on regular store shelves, gondolas, walls, pegs or other fixtures within the aisles. While it shares the goal of enhancing sales and customer experience, its scope is more centered on optimizing the everyday product layout within the store's standard shelving units.
Shelf Planograms provide a systematic guide for arranging products on a retail store shelf based on factors like product size, packaging, category, and shopper behavior. They aim to make the shopping experience efficient by ensuring that products are easy to find, well-organized, and in line with customer expectations. These planograms are often used when selling in a shelving concept and are also essential for daily store operations, inventory management, and maintaining a consistent product layout.
Examples of shelf image planograms:
- Category Planogram: Organizes products within a particular category or department of the store, ensuring similar items are grouped together for customer convenience.
- Assortment Planogram: Determines which products or SKUs should be carried in a specific store, optimizing the product mix to match customer preferences and local demand.
- Space Allocation Planogram: Allocates a specific amount of shelf space to each product or category based on factors like sales data, seasonality, or promotional needs, making the best use of available shelf space.
- Top Sellers Planogram: Highlights the top-selling products in the store and ensures they are given prime placement to maintain high sales.
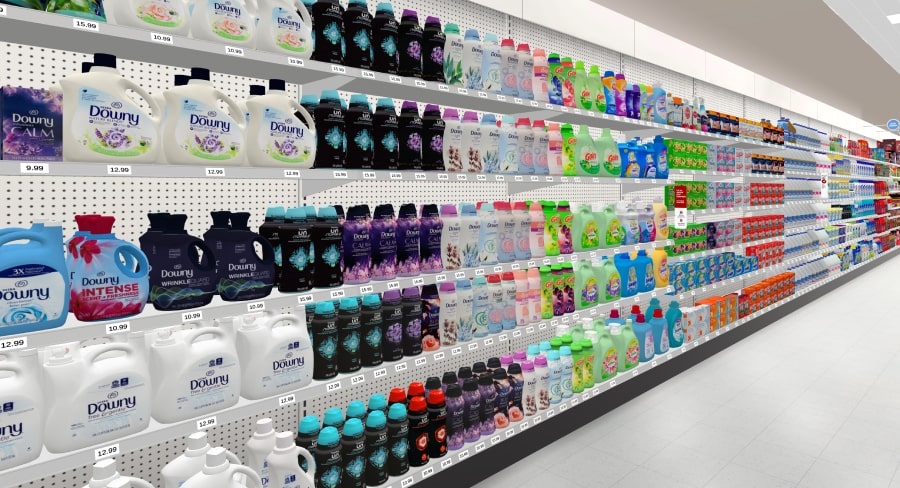
4. Schematic POG
A schematic planogram is designed to provide an easy-to-understand layout of the overall planogram for implementation in the field, particularly by stock clerks and store employees. Their main purpose is to simplify the process of reading planograms merchandising for execution.
Schematic planograms offer a more simplified and generalized representation of the planogram, focusing on the broader layout and positioning of sections, categories, and key product placements. They may not provide the level of detail seen in a shelf planogram and are instrumental in guiding stock clerks, store employees, and merchandisers to understand the broader layout and placement of various sections within the store. They help ensure that the overall planogram is implemented correctly and consistently across different store locations.
Examples of schematic planograms:
- Planogram reset: A process where the store's layout and product placements are reorganized by a retail reset merchandiser to improve the shopping experience, boost sales, and align with changing merchandising strategies. These resets are typically carried out by store staff several times a year to once every few years, in response to seasonal shifts, new product launches, or to refresh the store's appearance.
- Compliance Planogram: Compliance planograms provide specific instructions for how to set up displays, arrange products, and maintain store appearances. They are the responsibility of store staff to follow these guidelines to ensure that store displays maintain consistency across different store locations. Compliance may be monitored and assessed through regular checks, audits, and performance evaluations to ensure that brand consistency and operational standards are upheld.
5. Analysis POG
Unlike other planograms that primarily focus on instructing how products should be positioned, an analysis planogram serves as a tool for evaluating the effectiveness of the existing planograms and the store's overall layout. It typically includes metrics, data, and visual representations to help retailers make data-driven decisions and optimize their merchandising strategies.
The primary goal of an analysis POG is to continuously improve the store's merchandising strategies, enhance customer satisfaction, and drive increased sales by making evidence-based adjustments to product displays and store layouts. It is a valuable tool for retailers seeking to refine their in-store operations and maximize profitability.
Examples of analysis planograms:
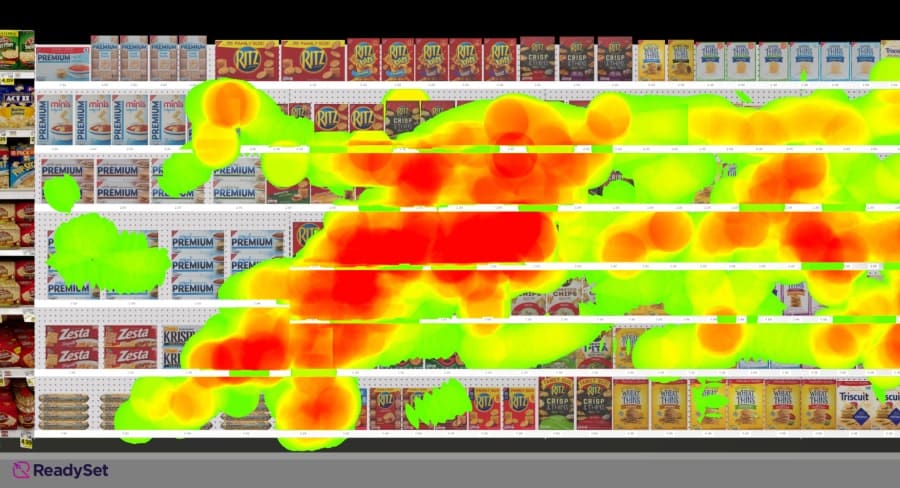
- Aisle Heatmap: An aisle heatmap is a visual representation of a store shelf that employs colors like red, yellow, and green to depict shopping patterns. It offers a clear view of where shoppers tend to focus their attention, with warmer colors indicating higher levels of interest and cooler colors showing areas that receive less attention. This tool is essential for analyzing consumer behavior, allowing retailers to optimize product placement, package design, and competitor comparisons, ultimately improving product positioning and timing.
- Path tracking heatmap: The path tracking heatmap involves the mapping of routes taken by planogram research participants as they move through a store. This is achieved through the use of a top-down camera view, which provides a bird's-eye perspective of shoppers' movements. This color-coded visualization assists researchers in identifying areas within the store that attract the most and least customer attention. It is a valuable tool for analyzing consumer behavior and decision-making.
6. POG Standard Reports
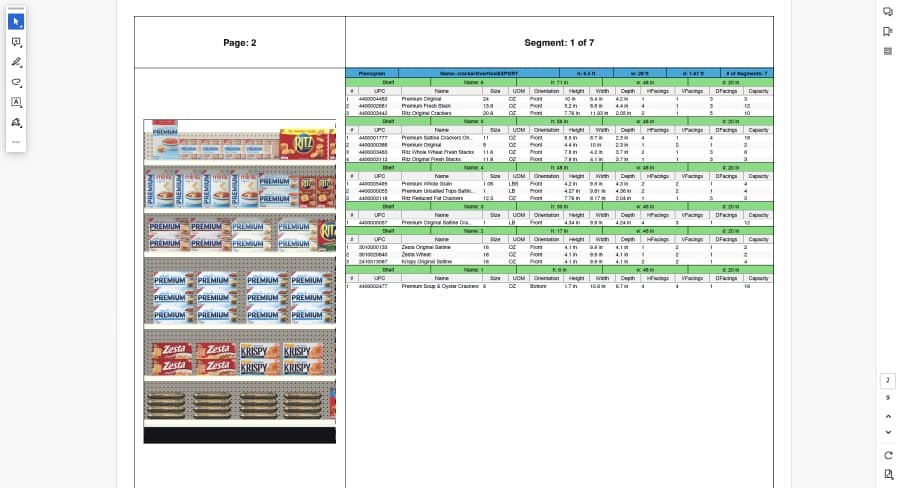
Planogram reports are a set of analytical reports and documents used in the retail industry to provide data-driven insights into the performance of planograms and product displays within a store. These reports differ within merchandising planogram software but offer a standardized format for presenting information related to planogram implementation, space utilization, expected financial performance, sales results, and product rankings.
POG standard reports are essential tools for retail management and visual merchandising teams, allowing them to evaluate the effectiveness of their store layouts and planograms. These reports are typically generated regularly, allowing retailers to monitor the performance of their store layouts and planograms over time. By utilizing POG Standard Reports, retailers can fine-tune their visual merchandising strategies and store layouts to optimize sales and enhance the overall shopping experience for customers.
Examples of standard planogram reports:
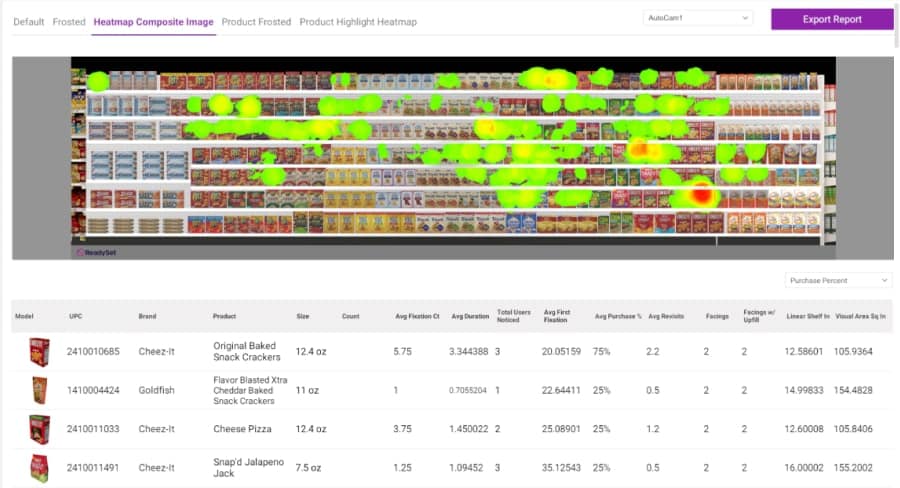
- Product Data: The product data available within research reports can be easily downloaded in a CSV file. It includes fundamental details about the products featured in the set, such as product images, UPCs (Universal Product Codes), brand names, product names, sizes, quantities, and facings. This rich source of product information equips researchers with the means to calculate a crucial metric known as "consumer stopping power." This metric assesses a product's ability to seize the attention of potential customers, prompting them to pause, take notice, and ultimately make a purchase.
- Shopper insight data: The heatmap visuals generated from shoppers' real-time experiences serve as the foundation for deriving shopper insight data. These insights are subsequently translated into actionable metrics, encompassing the average fixation count, attention duration, purchase percentage, number of revisits, and more. This data offers a holistic perspective on customer interactions with your products and store layout, facilitating a better understanding of what draws shoppers' attention, the duration of their engagement with specific elements, and their purchasing behavior.
Subscribe to our newsletter
Get our blogs and the latest retail news delivered to your inbox monthly.
Recent Posts
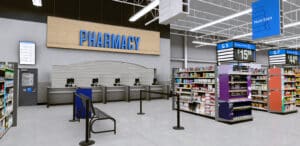
Pharmacy Merchandising Tech: 5 Powerful Ways to Boost OTC Sales
Here’s a staggering fact: Americans now buy over-the-counter (OTC) products 26 times a year-that’s 8x more often than they visit the doctor. With the OTC market exploding from 42 billion to 70 billion by 2033, the race is on for shelf space in 750,000+ stores. But here’s the problem, 44% of shoppers discover over-the-counter products…
How to Use 3D VR for Smarter Store Layout and Design
Explore how VR is revolutionizing grocery store layout and design planning by offering enhanced blueprint visualization in immersive 3D environments. Grocery store layout strategy is essential for establishing a positive and productive customer experience. A thoughtfully designed layout not only improves convenience but also fosters a sense of discovery, leading to longer, more enjoyable shopping…
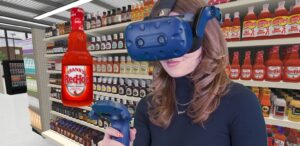
Sauce & Condiment Sales Heat Up as New Tech Helps Out
Young Millennials and Gen Z consumers have fueled a boom in hot sauce trends and condiment sales. This surge is pushing leading brands and retailers to elevate their game with smarter virtual product innovation and assortment optimization. The condiment and hot sauce industry is thriving in 2024, driven by evolving consumer tastes and the growing…